- Joined
- Dec 2, 2019
- Messages
- 201
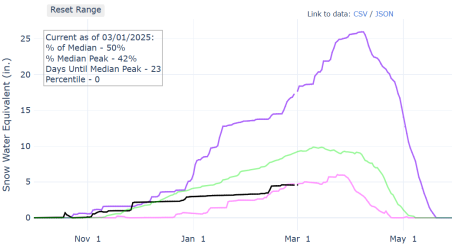
I hesitate to post this, since I have zero expertise in the interpretation of the data, but looking at the Snow Water Equivalent graphs from NRCS for Southeastern Utah seems to indicate that this could turn out to be a drier than average year, although I guess the next couple of months could still change that.
The graph below shows the current year in black, plus the 2 recent wet years of 2019 and 2023, the dry years of 2021 and 2022, and the average years of 2020 and 2024

The graph below shows the current year in black, plus the 2 recent wet years of 2019 and 2023, the dry years of 2021 and 2022, and the average years of 2020 and 2024

Last edited:

