- Joined
- Jun 25, 2012
- Messages
- 4,430
Disappointment
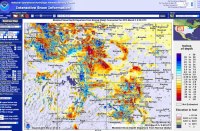
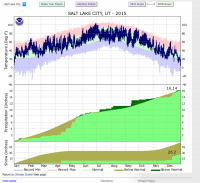
Well, similar to last years mountain snow pack the climate has run off the rails enough to pretty much ensure that we are going to have a very early spring in our high mountains. It was going pretty well in Utah until in February the El Nino firehose turned off and we had the second driest February in history. We will probably be able to get out in the high country snow free much earlier than normal. The disappointment is that the relentless, and forecast, climate change marches on unabated. This bodes poorly for the ecosystem and the long term water supply. Much of the lower than average snowpack - especially at low and mid elevations like my house at 7K' is due to much warmer than normal temperatures. This means much of the autumn, early winter, late winter and spring precipitation falls as rain and is not captured and stored in the snowpack. You can bemoan the bad luck of the situation or work to reduce man-induced climate change the choice being based on your belief system. There are bright spots of course. Much of the Wasatch is at or above normal in snowpack, parts of the Central Idaho mountains and the Beartooths. But the snow chart below (snowpack depth compared to average) is a lot more red and orange than cool blue.
Opportunity
Again I want to point out that this year there is an opportunity for a very early start of the backpacking season. I have started traveling in the high country months early the last two years and I will again this year. You will probably be able, depending on the weather, walk into the mountains much earlier than normal. But it is the weather after all so early mountain travel is not a foregone conclusion. So start your engines, make your plans and head out!
Data
The data below is again from the NOHRSC Snow Data site. I have referenced this source before. I consider this data authoritative and trustworthy. It is assembled from models, satellite data, Snowtels and boots on the ground.
The key is that yellow means less snow on the ground than average for this time of year. Orange and red are much less snow than normal on the ground compared to average. Red I'm talking like 3 feet less than normal. Go to the site and do your own investigation.
Notice:
The central and Southern Wind Rivers
The Tetons
Jellystone
The Wyoming Salt Range
The High Uintahs
North Rim of the Grand Canyon
etc. etc. etc.
Red,Yellow,Red,Yellow

http://www.nohrsc.noaa.gov/interactive/html/map.html?ql=station&zoom=3&loc=52.37+N,+117.43+W&var=ssm_depth_norm_d&dy=2016&dm=3&dd=5&dh=6&snap=1&o6=1&o9=1&o12=1&o13=1&lbl=m&mode=pan&extents=us&min_x=-124.89166666667&min_y=30.749999999996&max_x=-94.883333333335&max_y=52.574999999995&coord_x=-109.8875000000025&coord_y=41.662499999995504&zbox_n=&zbox_s=&zbox_e=&zbox_w=&metric=0&bgvar=dem&shdvar=shading&title=1&width=1100&height=800&nw=1100&nh=800&h_o=0&font=1&js=1&uc=0
Well, similar to last years mountain snow pack the climate has run off the rails enough to pretty much ensure that we are going to have a very early spring in our high mountains. It was going pretty well in Utah until in February the El Nino firehose turned off and we had the second driest February in history. We will probably be able to get out in the high country snow free much earlier than normal. The disappointment is that the relentless, and forecast, climate change marches on unabated. This bodes poorly for the ecosystem and the long term water supply. Much of the lower than average snowpack - especially at low and mid elevations like my house at 7K' is due to much warmer than normal temperatures. This means much of the autumn, early winter, late winter and spring precipitation falls as rain and is not captured and stored in the snowpack. You can bemoan the bad luck of the situation or work to reduce man-induced climate change the choice being based on your belief system. There are bright spots of course. Much of the Wasatch is at or above normal in snowpack, parts of the Central Idaho mountains and the Beartooths. But the snow chart below (snowpack depth compared to average) is a lot more red and orange than cool blue.
Opportunity
Again I want to point out that this year there is an opportunity for a very early start of the backpacking season. I have started traveling in the high country months early the last two years and I will again this year. You will probably be able, depending on the weather, walk into the mountains much earlier than normal. But it is the weather after all so early mountain travel is not a foregone conclusion. So start your engines, make your plans and head out!
Data
The data below is again from the NOHRSC Snow Data site. I have referenced this source before. I consider this data authoritative and trustworthy. It is assembled from models, satellite data, Snowtels and boots on the ground.
The key is that yellow means less snow on the ground than average for this time of year. Orange and red are much less snow than normal on the ground compared to average. Red I'm talking like 3 feet less than normal. Go to the site and do your own investigation.
Notice:
The central and Southern Wind Rivers
The Tetons
Jellystone
The Wyoming Salt Range
The High Uintahs
North Rim of the Grand Canyon
etc. etc. etc.
Red,Yellow,Red,Yellow

http://www.nohrsc.noaa.gov/interactive/html/map.html?ql=station&zoom=3&loc=52.37+N,+117.43+W&var=ssm_depth_norm_d&dy=2016&dm=3&dd=5&dh=6&snap=1&o6=1&o9=1&o12=1&o13=1&lbl=m&mode=pan&extents=us&min_x=-124.89166666667&min_y=30.749999999996&max_x=-94.883333333335&max_y=52.574999999995&coord_x=-109.8875000000025&coord_y=41.662499999995504&zbox_n=&zbox_s=&zbox_e=&zbox_w=&metric=0&bgvar=dem&shdvar=shading&title=1&width=1100&height=800&nw=1100&nh=800&h_o=0&font=1&js=1&uc=0
Last edited:


