fossana
Member
- Joined
- Jan 11, 2018
- Messages
- 1,038
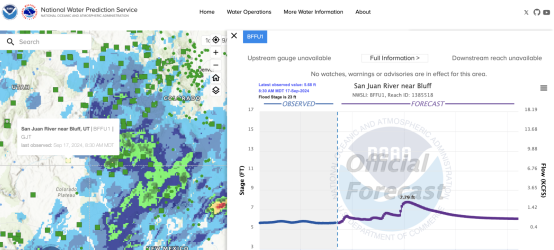
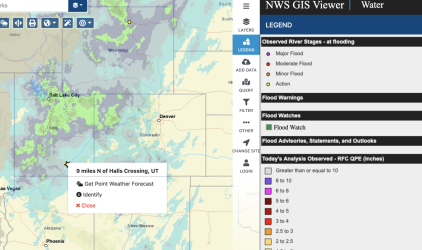
I just noticed that NOAA/NWS launched a new online map that combines surface water data with past precipitation, very handy for desert trip planning. Unlike the USGS water dashboard, which shows observed, the surface water plot also includes a forecast. This appears to have replaced the older AHPS Precipitation Analysis map, since the old URL now redirects.

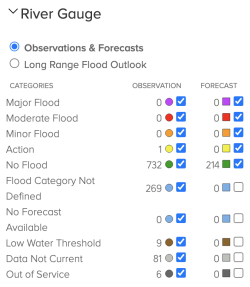
The gauge icon colors indicate whether there has been a flood or severe drought:


The gauge icon colors indicate whether there has been a flood or severe drought:


