- Joined
- Dec 2, 2019
- Messages
- 219
Following on from John's (@John Morrow) very interesting look at the recent rainfall data for the South-West, I thought I'd have a (very unscientific) look at some previous years that also had high levels of precipitation. I then also extracted the data for how these previous years then panned out in terms of Snow Water Equivalent over the following months.
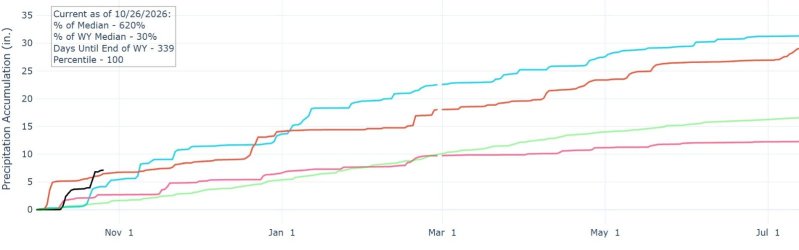
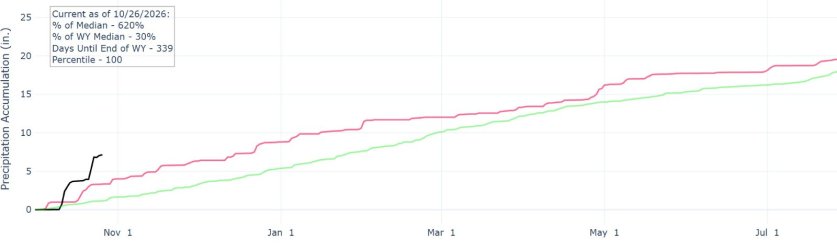
I selected the Escalante-Paria area. Unsurprisingly, 2026/27 appears to be a record-breaking year so far for rainfall in this area; it would normally take until the end of January for Escalante to have this much cumulative precipitation !
Whether this information will have any bearing on the next few months into 2027, who knows; but it's still interesting to see I think (lingering snow in June next year !! )
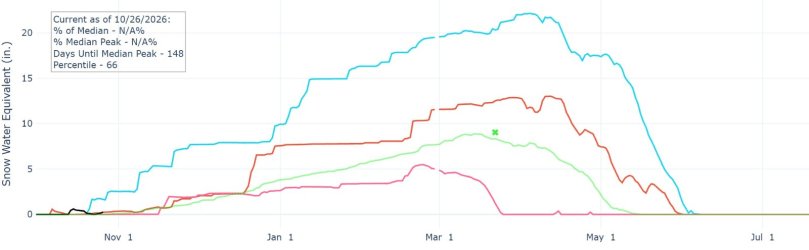
Two of the wettest years over recent decades were 2004/5 and 2010/11. These are the blue and red lines on the graphs below. The black line is the current year; the green line is the 30 year median. The pink line is 2025/26, for recent comparison, which had relatively low rainfall and SWE totals. (In fact, all snow had effectively melted by March 25th in 2026; some 50 days earlier than average !)
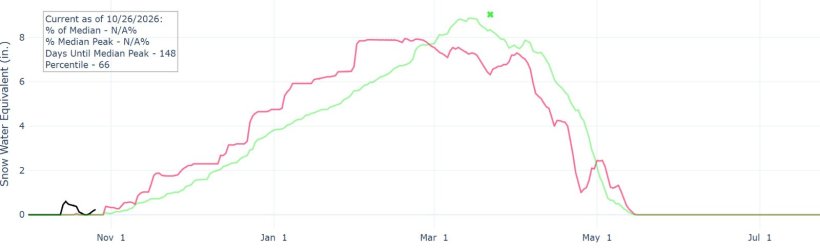
I also had a quick look at the most recent Super El Nino year of 2015/16 and, somewhat disappointingly, both precipitation and snow water levels over the period were very close to the overall median data.
(To extract this data I used this NWCC website for Utah. By using the Basin Plots pulldown on this page, different states can be selected).
.I selected the Escalante-Paria area. Unsurprisingly, 2026/27 appears to be a record-breaking year so far for rainfall in this area; it would normally take until the end of January for Escalante to have this much cumulative precipitation !
Whether this information will have any bearing on the next few months into 2027, who knows; but it's still interesting to see I think (lingering snow in June next year !!
)Two of the wettest years over recent decades were 2004/5 and 2010/11. These are the blue and red lines on the graphs below. The black line is the current year; the green line is the 30 year median. The pink line is 2025/26, for recent comparison, which had relatively low rainfall and SWE totals. (In fact, all snow had effectively melted by March 25th in 2026; some 50 days earlier than average !)
I also had a quick look at the most recent Super El Nino year of 2015/16 and, somewhat disappointingly, both precipitation and snow water levels over the period were very close to the overall median data.
(To extract this data I used this NWCC website for Utah. By using the Basin Plots pulldown on this page, different states can be selected).
.
.
.
For 2015/16
.
.
.
.
.
Last edited: